Crypto fund risk management is not a theoretical exercise — it is the difference between surviving an 80% crash and shutting down permanently. Between May 2022 and December 2023, approximately 250 of 715 crypto-dedicated hedge funds closed — a 35% attrition rate — as Bitcoin crashed 77.6% from its November 2021 all-time high. Liquid crypto fund assets under management collapsed from $35 billion to $15.2 billion. Yet the funds that survived — and in many cases thrived — shared a common trait: systematic, institutional-grade risk management frameworks that no retail investor replicates by simply holding Bitcoin.
This article examines what separates the survivors from the blowups, using real performance data from Galaxy's VisionTrack indices, the AIMA 7th Annual Global Crypto Hedge Fund Report (2025), and documented case studies of both catastrophic failures and successful risk management in action.
The Drawdown Reality: Bitcoin's History of 70%+ Crashes
Bitcoin is not merely volatile — it is structurally prone to extreme drawdowns. Since 2011, Bitcoin has experienced six drawdowns exceeding 70% from all-time highs. Each crash wiped out the majority of paper gains accumulated during the preceding bull run, yet Bitcoin recovered to new highs after every single one — typically within 16 to 24 months.
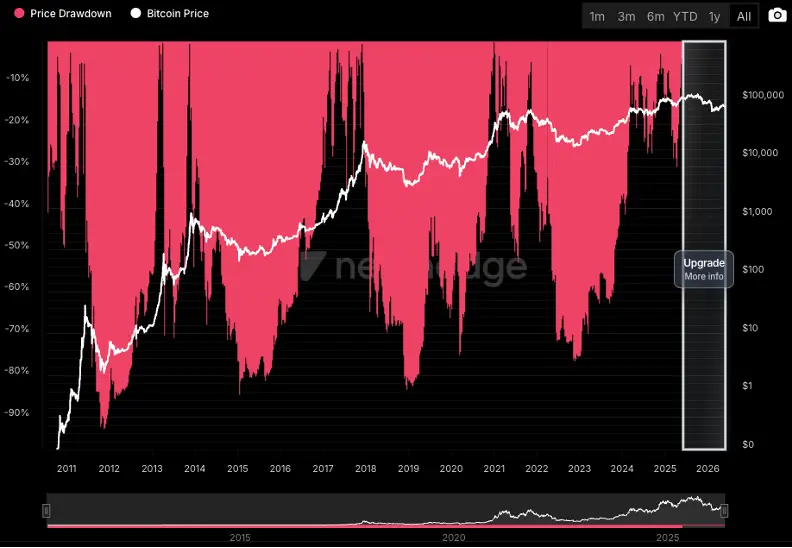
Source: Newhedge — Bitcoin Price Drawdown from All-Time High (2011-2026). Pink bars represent drawdown depth; white line shows BTC price on log scale.
Crash Period | BTC Peak-to-Trough | VisionTrack Composite | Market Neutral Index | Recovery Time |
Jun 2011 - Jan 2012 | -93% | N/A (pre-fund era) | N/A | ~18 months |
Dec 2013 - Jan 2015 | -84% | N/A | N/A | ~36 months |
Dec 2017 - Dec 2018 | -83% | -46% (est.) | +17.96% | ~24 months |
Nov 2021 - Nov 2022 | -77.6% | -37.85% | -3.57% | ~16 months |
Oct 2025 - Feb 2026 | -46.7% | Data pending | Data pending | Ongoing |
The critical column in this table is Market Neutral. While Bitcoin fell 77.6% in 2022, the VisionTrack Market Neutral Index — which tracks funds using hedged, direction-agnostic strategies — lost only 3.57%. In 2018, market-neutral funds actually gained 17.96% while Bitcoin collapsed 83%. This is not luck. It is the result of specific, repeatable risk management practices that professional fund managers deploy systematically.
The Survivors vs The Blowups: What Separated Them
The Blowups: Three Arrows Capital, Celsius, and the Failure of 'Conviction'
Three Arrows Capital (3AC) managed approximately $3 billion at its peak. Its collapse in June 2022 was not caused by market conditions alone — it was caused by the complete absence of risk management. The fund held massive concentrated positions in LUNA/UST (estimated $200-560 million exposure), used excessive leverage with borrowed capital, maintained no hedging or options protection whatsoever, and operated with zero position-sizing discipline. When LUNA collapsed from $80 to near zero in May 2022, 3AC's losses cascaded across the industry — triggering the bankruptcy of Voyager Digital ($670 million exposure to 3AC), accelerating Celsius Network's insolvency, and ultimately contributing to BlockFi's collapse.
The pattern was identical across every major crypto blowup of 2022: concentrated positions, no hedging, borrowed capital deployed into speculative assets, and risk management treated as an afterthought rather than a core function.
The Survivors: How Pantera, Galaxy, and Market-Neutral Funds Navigated the Crash
Funds that survived the 2022-2023 drawdown shared common characteristics that directly mirror institutional risk management best practices. Pantera Capital maintained gross leverage between 1.0-1.3x (compared to 3AC's estimated 5-10x), held 10-20% of assets in stablecoins or cash equivalents for liquidity, and conducted quarterly stress testing against historical crash scenarios. Galaxy Digital used derivatives overlays to hedge directional exposure, maintained diversified positions across asset classes (not just crypto), and had institutional-grade custody through regulated custodians. Market-neutral funds, by design, eliminated directional risk entirely — earning returns from funding rates, basis trades, and arbitrage regardless of whether Bitcoin moved up or down.
The Data: VisionTrack Crypto Hedge Fund Indices vs Bitcoin
Galaxy's VisionTrack indices provide the most comprehensive public dataset comparing managed crypto fund performance against Bitcoin. The data reveals a consistent pattern: managed funds capture a meaningful portion of Bitcoin's upside while dramatically reducing downside exposure.
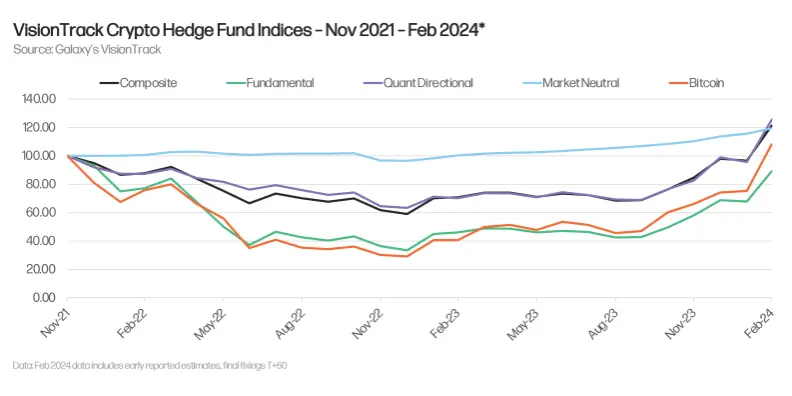
Source: Galaxy VisionTrack — Crypto Hedge Fund Indices vs Bitcoin (Nov 2021 - Feb 2024). Market Neutral (light blue) remained stable while Bitcoin (orange) crashed over 60%.
Year | Bitcoin | VisionTrack Composite | Fundamental | Quant Directional | Market Neutral |
2018 | -73% | -46% (est.) | -55% (est.) | -30% (est.) | +17.96% |
2019 | +92% | +30% (est.) | +25% (est.) | +35% (est.) | +16.92% |
2020 | +305% | +93% (est.) | +120% (est.) | +80% (est.) | +38.71% |
2021 | +60% | +45% (est.) | +55% (est.) | +40% (est.) | +44.21% |
2022 | -63.83% | -37.85% | -52.07% | -28.36% | -3.57% |
2023 | +153.01% | +64.02% | +101.96% | +56.41% | +18.48% |
2024 | +120% | +40% | +40.4% | +53.7% | +18.5% |
The pattern is unmistakable. In 2022, when Bitcoin fell 63.83%, the VisionTrack Composite lost 37.85% — roughly 40% less drawdown than unmanaged Bitcoin exposure. Market-neutral funds lost a mere 3.57%. In 2023, when Bitcoin surged 153%, the Composite returned 64.02% and market-neutral funds earned 18.48% — demonstrating that these strategies capture meaningful upside while maintaining downside protection. By 2024, the same pattern held: Bitcoin climbed 120% while the Composite delivered 40% and market-neutral returned 18.5%.
In bull markets, managed funds capture less upside — but the risk-adjusted return (Sharpe ratio) of managed funds consistently exceeds Bitcoin's, because the denominator — volatility — is dramatically lower. An investor who earned 40% with a maximum drawdown of 15% has a materially higher Sharpe ratio than one who earned 120% with a 77% drawdown. Over multiple market cycles, compounding at lower volatility produces more reliable long-term wealth accumulation than maximum exposure with catastrophic drawdowns.
The Risk Management Toolkit: What Professional Crypto Funds Actually Use
The AIMA 2025 report surveyed 122 hedge fund managers representing $982 billion in AUM. The findings confirm that institutional crypto risk management has matured rapidly — 67% of hedge funds now use crypto derivatives for hedging, up from 58% in 2024 and just 38% in 2023.
Risk Management Tool | What It Does | Adoption Rate (2025) | Drawdown Impact |
Crypto Derivatives (Futures/Options) | Hedge directional exposure; profit in both directions | 67% of hedge funds | Reduces drawdown 40-60% |
Delta-Neutral Strategies | Long spot + short perpetual futures to earn funding rates | 25% (market-neutral funds) | Near-zero directional exposure |
Position Sizing (<2% AUM) | Limit crypto to small portfolio allocation | 52% allocate <2% AUM | Caps portfolio-level drawdown |
Third-Party Custody | Institutional custodians (Fireblocks, Anchorage) | 73% of hedge funds | Eliminates exchange counterparty risk |
Stop-Loss / Automated Exits | Pre-set exit points triggered by price movements | Common across quant funds | Limits tail risk on individual positions |
Cash / Stablecoin Reserve | Maintain 10-20% liquidity buffer | Standard institutional practice | Provides buying power during crashes |
Stress Testing | Model portfolio under historical crash scenarios | Required by institutional LPs | Pre-identifies concentration risk |
Legal & Compliance Infrastructure | Regulatory compliance, audit, tax structuring | 40% (up from 17% in 2024) | Reduces operational and regulatory risk |
The most important insight from this data: no single tool provides adequate protection. The funds that survived 2022 used multiple layered risk controls simultaneously — derivatives hedging combined with position sizing, custody diversification, cash reserves, and systematic rebalancing. Three Arrows Capital used none of them. The sharp increase in legal and compliance investment — from 17% of funds citing it as a priority in 2024 to 40% in 2025 — underscores that institutional managers now treat regulatory and operational risk as seriously as market risk.
The Institutional Shift: 55% of Hedge Funds Now Hold Crypto
The AIMA 2025 survey marks a tipping point. For the first time, more than half of traditional hedge funds (55%) now have some exposure to crypto assets — up from 47% in 2024, 29% in 2023, and 37% in 2022. This is not speculative retail activity. These are institutional managers with an average AUM of $14.8 billion deploying capital with formal risk frameworks.
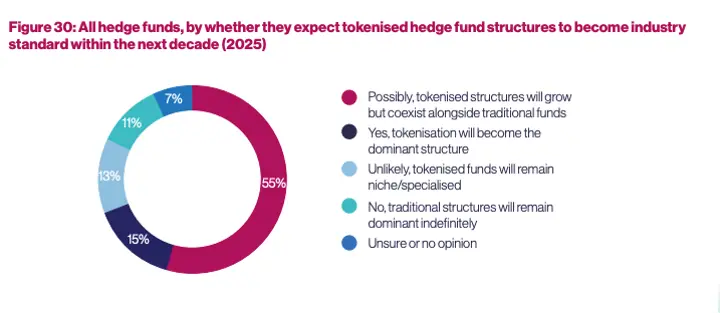
Source: AIMA 7th Annual Global Crypto Hedge Fund Report (2025) — Figure 30: Hedge fund expectations for tokenised fund structures within the next decade.
The strategy composition tells a revealing story about risk management priorities. Multi-strategy funds dominate at 29%, followed by market-neutral at 25% — meaning more than half of all crypto hedge funds prioritise risk-adjusted returns over pure directional bets. Long-only strategies (24%) and long/short (14%) make up the remainder. The average crypto hedge fund AUM has grown from $41 million in 2023 to $79 million in 2024 to $132 million in 2025, reflecting both market appreciation and new institutional capital flows. Critically, 71% of crypto-investing hedge funds plan to increase exposure in the next 12 months, and 73% say they would allocate more if custody and trading infrastructure improved.
What This Means for Indian Investors: The Case for Managed Crypto Exposure
The data makes an uncomfortable argument for self-directed crypto investors. Retail investors who buy Bitcoin on exchanges and hold through crashes experience the full 70-80% drawdown with no hedging, no derivatives protection, no professional rebalancing, and no risk framework. They are, in effect, running a long-only directional strategy — the category with the highest drawdowns in VisionTrack's dataset.
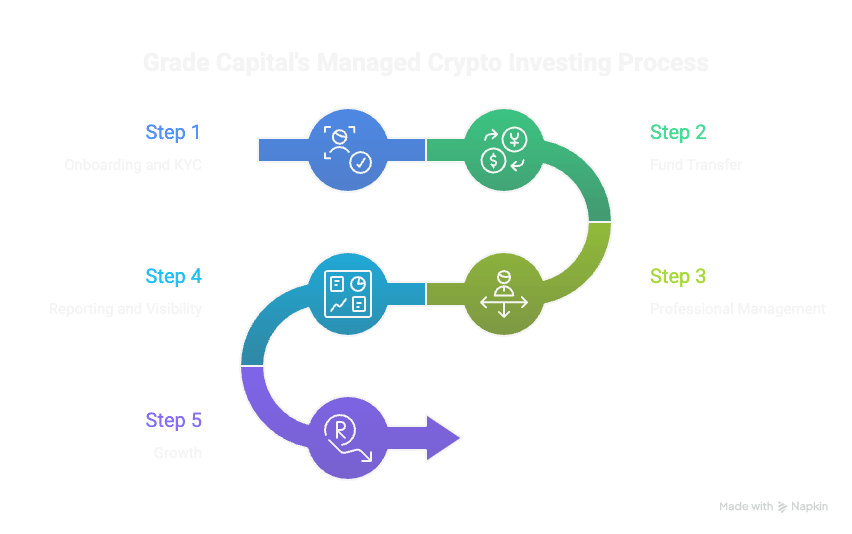
Managed crypto portfolios — whether through hedge funds globally or platforms like Grade Capital in India — apply the same institutional risk management tools documented in this article: derivatives-based hedging, position sizing, systematic rebalancing, and professional custody.
For Indian investors specifically, there is an additional structural advantage. Crypto derivatives — futures and options — are classified as speculative business income under Section 43(5) and are taxed at income slab rates rather than the flat 30% VDA tax. This means a managed derivatives portfolio can provide crypto exposure with materially lower tax drag compared to direct spot Bitcoin ownership — while simultaneously offering professional risk management that reduces drawdowns.
The October 2025 crash — Bitcoin falling 46.7% from its all-time high of $126,296 — offers a real-time case study. While retail investors watched portfolios halve in value with no recourse, the AIMA 2025 survey had already documented that 67% of institutional hedge funds were using derivatives for hedging before the crash hit. Funds that had established market-neutral positions, maintained stablecoin reserves, and used options protection were able to navigate the drawdown with controlled losses — or in some cases, outright gains from short positions and volatility trades. This is the fundamental asymmetry between institutional and retail crypto exposure.
The question for Indian investors is not whether Bitcoin will crash again — history guarantees it will. The question is whether you will face that crash with institutional-grade risk management or without it.
Disclaimer: This content is for informational and educational purposes only and does not constitute financial advice or an offer to invest. Past performance is not indicative of future results. The data presented uses publicly available index performance figures and fund reports; actual individual fund performance may vary materially. Tax treatment depends on individual circumstances and the prevailing interpretation of tax laws. Investors are advised to consult qualified tax and investment professionals. Historical drawdown data and recovery statistics are estimates and not forecasts of actual future performance.