Sharpe Ratio Explained: Why Risk-Adjusted Returns Matter in Crypto
The crypto Sharpe Ratio reveals what raw return numbers cannot: how much risk was taken to earn those returns. A fund that delivered 80% with low volatility is a different animal from a fund that delivered 80% on a rollercoaster. The Sharpe Ratio measures that difference.
The Sharpe Ratio in Plain Terms
Two drivers leave Delhi for Jaipur.
The first takes the expressway: smooth road, steady speed, arrives in four hours. The second takes a shortcut through village roads — potholes, diversions, a wrong turn, two tyre punctures. The second also arrives in four hours.
Same destination. Same time. The quality of the journey was not the same.
The Sharpe Ratio measures the quality of an investment's journey, not its destination.
The technical version: it measures how much excess return — return above the risk-free rate — an investment generates for every unit of risk, where risk is volatility. A higher Sharpe Ratio means risk is being converted into return more efficiently.
The formula is straightforward:
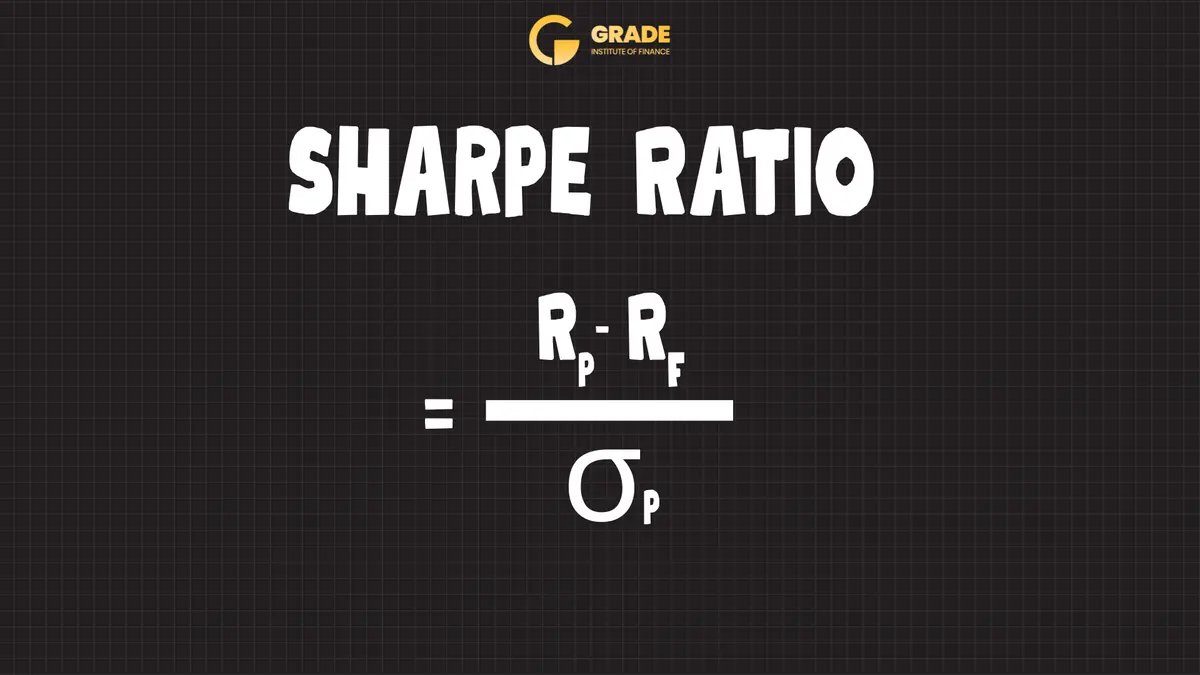
Sharpe Ratio = (Portfolio Return − Risk-Free Rate) ÷ Standard Deviation of Portfolio Returns
The risk-free rate is what an investor would earn with zero risk — typically the yield on government bonds. In India, the 10-year government bond yield is the common benchmark. In global crypto analysis, a 5% annual rate is the standard assumption.
William F. Sharpe — the Nobel Prize-winning economist — introduced the ratio in 1966. Six decades later, it remains the most widely used measure of risk-adjusted performance across every asset class, including crypto.
Why Absolute Returns Lie
A statement repeated constantly in crypto: "This fund returned 100% last year."
The line lands well. It says almost nothing about whether the investment was well-managed. Context matters.
Consider two hypothetical crypto funds — Fund A and Fund B. Both delivered an 80% annual return. Most investors would call them equal performers. The Sharpe Ratio tells a different story.
Metric | Fund A | Fund B |
Annual Return | 80% | 80% |
Volatility (Std Dev) | 60% | 30% |
Sharpe Ratio (5% risk-free) | 1.25 | 2.50 |
What It Means | High return, but a wild ride | Same return, half the turbulence |
Fund B delivered the same 80% return at half the volatility. Its Sharpe Ratio is double Fund A's. The same destination, reached with fewer sharp swings.
This is why absolute returns lie. They tell the investor where the journey ended. They say nothing about how it got there.
In a bull market, almost everything goes up. A fund that returned 100% during a period when Bitcoin rose 120% did not demonstrate skill — it rode the wave. The Sharpe Ratio strips away that noise and reveals whether the return came from a working strategy or from favourable timing.
Why This Matters Even More in Crypto
Crypto is one of the most volatile asset classes available to investors. Bitcoin's annualised volatility has historically ranged between 50% and 80%. Altcoins routinely run higher.
In a market where everything swings, the Sharpe Ratio becomes the clearest signal of investment quality.
A cricket analogy makes the point. Two batsmen each score 50. One played a calm, composed knock — clean drives, steady rotation, minimal risk. The other survived three dropped catches, edged four boundaries through the slips, and was hit on the helmet twice.
Same score. Different quality of innings. The first batsman's "Sharpe Ratio" is materially higher — the same result, with less risk of getting out.
In crypto, the distinction is critical. High volatility means returns can vanish as quickly as they appear.
A fund with an 80% return and a Sharpe of 1.25 can swing negative in the next quarter. A fund with the same return and a Sharpe of 2.50 is more likely to sustain it — its result was not built on extreme market moves.
Sharpe Ratio Benchmarks That Matter
Not all Sharpe Ratios are equal. The benchmarks used across the investment industry:
Below 0. The investment returned less than the risk-free rate. Government bonds would have produced a better outcome with no effort.
0 to 1.0. Positive, but not impressive. There is some excess return over bonds — not enough to justify the volatility taken to earn it.
1.0 to 2.0. Good. The investment is producing meaningful return per unit of risk. Most well-managed funds across asset classes sit here. In crypto, where the volatility floor is high, a sustained Sharpe above 1.0 is a strong signal.
2.0 to 3.0. Very good. Strong risk-adjusted performance — high returns with comparatively low volatility. In crypto, this level is harder to reach and harder to sustain than in traditional asset classes.
Above 3.0. Excellent, and rare. Sustained Sharpe Ratios above 3.0 over multiple years are uncommon in any asset class. They usually signal exceptional risk management paired with favourable market conditions.
One nuance: the time period matters. A fund can show a Sharpe of 3.0 over a six-month favourable window, and a much lower Sharpe over three years that include both bull and bear cycles. Always read the Sharpe Ratio across the longest available period — ideally two years or more.
Higher Return vs Higher Sharpe Ratio
The choice between the two separates a sophisticated investor from the rest.
Two more hypothetical funds:
Metric | Fund X | Fund Y |
Annual Return | 120% | 75% |
Volatility (Std Dev) | 80% | 25% |
Sharpe Ratio (5% risk-free) | 1.44 | 2.80 |
What It Means | Higher returns, rougher ride | Lower returns, remarkably consistent |
Two more hypothetical funds:Fund X has the higher return. Fund Y has the higher Sharpe Ratio. The better of the two is not obvious.
The answer depends on the investor's priorities. What experienced investors know: high Sharpe Ratios compound better over time. A fund delivering 75% consistently with low volatility is less exposed to the catastrophic drawdown that wipes out years of gains. A fund delivering 120% with extreme volatility can hand back half of those gains in a single bad month.
Consistency is not exciting. It is what builds wealth across multi-year horizons.
The exam analogy applies. Scoring 95% on an easy exam is less impressive than scoring 75% on a difficult one. The Sharpe Ratio adjusts for the difficulty level — volatility — and tells the investor what the performance was actually worth relative to the risk environment.
Beyond the Sharpe: Other Metrics Worth Knowing
The Sharpe Ratio does not tell the full story on its own. A few complementary metrics round out the picture.
Metric | What It Measures | Why It Matters |
Sharpe Ratio | Excess return per unit of total volatility | Overall risk-adjusted performance |
Sortino Ratio | Excess return per unit of downside volatility only | Distinguishes "good" volatility (gains) from "bad" volatility (losses) |
CAGR | Compound Annual Growth Rate | Total return over time, but says nothing about risk |
Standard Deviation | How much returns vary from the average | Raw measure of volatility — higher means more unpredictable |
The Sortino Ratio deserves separate attention. The Sharpe Ratio penalises all volatility equally — both upside and downside. The Sortino Ratio penalises only the downside. That distinction is more useful for investors, because upside volatility — an investment moving up sharply — is not the problem the metric needs to flag.
A fund with a Sharpe of 1.4 and a Sortino of 1.8 is signalling something specific: most of its volatility comes from gains, not losses. That is the asymmetry a crypto investor should want.
Using the Sharpe Ratio in a Crypto Evaluation
A practical checklist for applying the Sharpe Ratio in an evaluation:
Ask for the Sharpe Ratio over at least two years. Short-term Sharpe Ratios mislead — a six-month bull market makes any fund look good. Two or more years of data, spanning different market conditions, produces a reliable picture.
Compare like with like. A crypto fund's Sharpe Ratio should be measured against other crypto funds, or against Bitcoin's standalone Sharpe Ratio — not against equity mutual funds, which operate in a different volatility environment.
Read the Sortino Ratio alongside. A Sortino materially higher than the Sharpe means the fund's volatility is skewed to the upside — a positive signal.
Do not chase the highest number. A Sharpe of 1.4 over three years of live data is more reliable than a Sharpe of 3.0 over six months of backtested data. Always check whether the performance is live — actual capital at work — or backtested.
Factor in the risk-free rate. Different calculations use different rates — India's bond yield versus the global 5% assumption. Sharpe Ratios should be compared on the same basis, or not at all.
The Bottom Line
Crypto investing produces a steady supply of impressive-sounding numbers. Triple-digit returns. Major bull runs. Screenshots of portfolio gains. None of them answer the question that matters: how efficiently was the return produced relative to the risk taken.
That is what the crypto Sharpe Ratio answers.
A high return with high volatility is a gamble that paid off. A high return with low volatility is a strategy built to deliver. The Sharpe Ratio is what tells the two apart — and in an asset class this volatile, that distinction is the whole picture.
Before evaluating a crypto fund, a basket, or any investment product, ask for the Sharpe Ratio. It will say more about the quality of the returns than the return figure on its own.
Grade Capital publishes the Sharpe and Sortino Ratios of its managed crypto portfolio at grade.capital.
This content is for informational and educational purposes only and does not constitute financial advice or an offer to invest.