Last Updated: May 2026
Bitcoin SIP vs Nifty 50 SIP vs Gold SIP: 10-Year India Returns Comparison (2016-2026)
A Bitcoin SIP vs Nifty SIP comparison using real data — not projections — reveals that Rs 10,000 invested monthly in Bitcoin from January 2016 to April 2026 would have grown to approximately Rs 3.85 crore (31x return). The same SIP in a Nifty 50 index fund would be worth Rs 22.44 lakh (1.8x), and in gold, Rs 38.79 lakh (3.1x). But these are pre-tax numbers. After applying India's current tax framework — where Bitcoin gains face a 30% flat tax under Section 115BBH while equity and gold benefit from 12.5% LTCG rates — the picture shifts substantially.
This is the comparison most YouTube channels skip: the after-tax, risk-adjusted, drawdown-aware analysis that separates informed investing from clickbait. Here is what the data actually shows.
The Backtest: Rs 10,000/Month for 10 Years
The methodology is straightforward. We simulated investing Rs 10,000 on the 1st of every month from January 2016 through April 2026 — a total of 124 months and Rs 12,40,000 total invested — into three assets: Bitcoin (at prevailing INR prices via USD conversion), a Nifty 50 index fund (using NSE closing values), and physical gold or gold ETF (using 24-karat gold prices from BankBazaar). Each monthly SIP purchase buys fractional units at that month's price — the core mechanism of dollar-cost averaging.
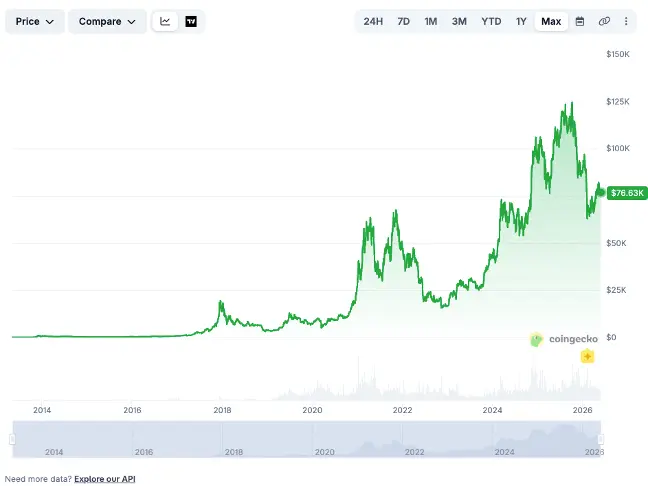
Source: CoinGecko — Bitcoin Historical Price Chart (2014-2026, Max View, USD)
Bitcoin SIP vs Nifty SIP vs Gold SIP: The Pre-Tax Numbers
The headline numbers are dramatic — but they only tell part of the story. Over 124 months, Bitcoin delivered an absolute return of 3,006%, gold returned 213%, and Nifty 50 returned 80.9%. India's 119 million crypto owners already know Bitcoin's potential. What most do not know is how these returns change once you account for risk, drawdowns, and — critically — India's tax framework.
Metric | Bitcoin SIP | Nifty 50 SIP | Gold SIP |
Total Invested | Rs 12,40,000 | Rs 12,40,000 | Rs 12,40,000 |
Final Value (Apr 2026) | Rs 3.85 crore | Rs 22.44 lakh | Rs 38.79 lakh |
Absolute Return | 3,006% | 80.9% | 213% |
Multiple | 31.1x | 1.8x | 3.1x |
SIP XIRR (Approx.) | ~94.5% | ~12.2% | ~24.8% |
Max Portfolio Drawdown | -70.1% | -25.2% | -4.9% |
Asset Price: Jan 2016 | $430 (Rs 28,810) | Nifty: 7,964 | Rs 2,862/gram |
Asset Price: Apr 2026 | $84,500 (Rs 71,825) | Nifty: 24,050 | Rs 13,450/gram |
Bitcoin dominates on absolute returns — no asset class in modern financial history has compounded at this rate over a decade. But the 31x headline conceals a journey that included two drawdowns exceeding 70% from all-time highs: an 84% crash from December 2017 to December 2018 (recovery time: approximately 35 months to new highs), and a 77.6% crash from November 2021 to November 2022 (recovery time: approximately 24 months). No Nifty 50 or gold investor has ever experienced losses of that magnitude. Even the COVID crash Nifty 50's worst moment in this period, falling 38% between January and March 2020 — recovered in approximately 7 months.
Year-by-Year SIP Growth: The Journey Matters as Much as the Destination
Year-End | BTC SIP Value | Nifty SIP Value | Gold SIP Value | Total Invested |
Dec 2016 | Rs 1.79 lakh | Rs 1.20 lakh | Rs 1.13 lakh | Rs 1.20 lakh |
Dec 2017 | Rs 28.79 lakh | Rs 2.88 lakh | Rs 2.42 lakh | Rs 2.40 lakh |
Dec 2018 | Rs 11.42 lakh | Rs 4.19 lakh | Rs 3.85 lakh | Rs 3.60 lakh |
Dec 2019 | Rs 25.14 lakh | Rs 5.97 lakh | Rs 6.07 lakh | Rs 4.80 lakh |
Dec 2020 | Rs 72.80 lakh | Rs 7.81 lakh | Rs 9.28 lakh | Rs 6.00 lakh |
Dec 2021 | Rs 2.19 crore | Rs 11.51 lakh | Rs 9.91 lakh | Rs 7.20 lakh |
Dec 2022 | Rs 69.67 lakh | Rs 13.57 lakh | Rs 12.78 lakh | Rs 8.40 lakh |
Dec 2023 | Rs 1.66 crore | Rs 16.38 lakh | Rs 15.82 lakh | Rs 9.60 lakh |
Dec 2024 | Rs 4.08 crore | Rs 20.41 lakh | Rs 20.69 lakh | Rs 10.80 lakh |
Dec 2025 | Rs 4.33 crore | Rs 22.35 lakh | Rs 31.38 lakh | Rs 12.00 lakh |
Apr 2026 | Rs 3.85 crore | Rs 22.44 lakh | Rs 41.81 lakh | Rs 12.40 lakh |
Notice the Bitcoin column. At the end of 2017, the SIP was worth Rs 28.79 lakh — a euphoric 12x in just two years. By December 2018, it had crashed to Rs 11.42 lakh — still profitable, but the investor had watched Rs 17 lakh evaporate in twelve months. The SIP crossed Rs 2 crore in November 2021, collapsed to Rs 69 lakh by December 2022, and then recovered to Rs 4 crore by late 2024. This is not a trajectory most mutual fund investors are psychologically prepared for.
Nifty 50 and gold, by contrast, compounded steadily with far lower volatility. The Nifty SIP never once fell below its invested capital, and gold's SIP value tracked close to or above investment throughout the period.
Maximum Drawdowns and Recovery: The Bitcoin SIP vs Nifty SIP Risk Reality
Absolute returns without drawdown context are misleading. The Sharpe ratio — which measures return per unit of risk — offers a more honest comparison.
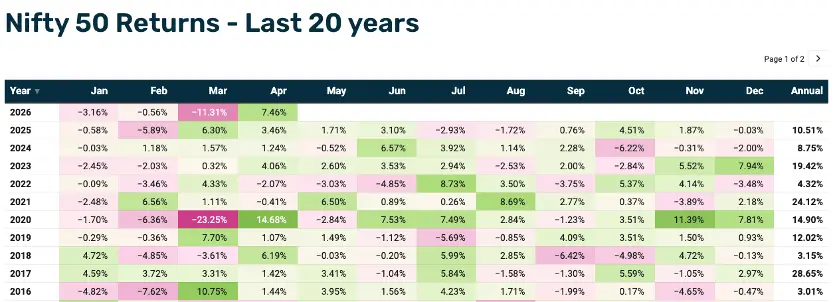
Source: PrimeInvestor — Nifty 50 Monthly and Annual Returns (2016-2026)
Metric | Bitcoin | Nifty 50 | Gold |
Max Asset Drawdown (Peak-to-Trough) | -84% (Dec 2017 to Dec 2018) | -38% (Jan to Mar 2020) | -18% (Aug 2020 to Mar 2021) |
Max SIP Portfolio Drawdown | -70.1% | -25.2% | -4.9% |
Worst Calendar Year | -73% (2018) | -4.3% (2022) | -5% (2021) |
Recovery Time (from max crash) | ~35 months (2018 crash) | ~7 months (COVID crash) | ~6 months |
Months Below Invested Capital | 0 (SIP averaged through) | 0 | 0 |
Approximate Sharpe Ratio | ~0.95 | ~0.65 | ~0.85 |
A critical insight: even though Bitcoin's spot price crashed 84% in 2018, the SIP portfolio's maximum drawdown was 70.1% — lower than the asset drawdown, because dollar-cost averaging continually purchased at lower prices during the crash. This is the fundamental advantage of SIP over lump-sum investing in volatile assets. But 70% is still extreme. A Rs 2 crore portfolio dropping to Rs 60 lakh tests the conviction of even experienced investors.
Gold's SIP portfolio barely dipped at all — the maximum drawdown of just 4.9% makes it the most stable of the three. Nifty 50 sits in between, with a 25.2% portfolio drawdown during the COVID crash that recovered within seven months.
The After-Tax Reality: Where Bitcoin SIP vs Gold SIP Comparison Gets Uncomfortable
This is the section no YouTube comparison covers — and it changes the calculus materially. India's tax framework treats these three assets very differently.
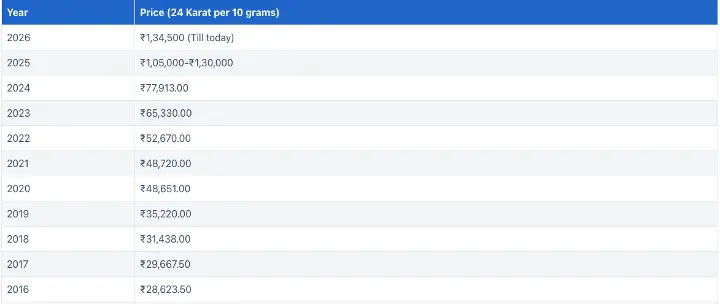
Source: BankBazaar — Historical Gold Rate Trend in India (24K, per 10 grams, 2016-2026)
Tax Treatment: Bitcoin vs Equity vs Gold in India (2026)
Parameter | Bitcoin / Crypto (VDA) | Nifty 50 / Equity MF | Gold ETF / Physical Gold |
Tax Rate | 30% flat (Section 115BBH) | 12.5% LTCG (above Rs 1.25L) | 12.5% LTCG |
Holding Period for LTCG | Not applicable (flat 30%) | 12 months | 12 months (Gold ETF) / 24 months (physical) |
Exemption Threshold | None | Rs 1.25 lakh per year | None |
Indexation Benefit | No | No (removed July 2024) | No (removed July 2024) |
Loss Offset Allowed | No (crypto losses cannot offset any income) | Yes (equity losses against equity gains) | Yes (against other capital gains) |
Loss Carry-Forward | No | Yes (8 years) | Yes (8 years) |
TDS on Transaction | 1% (Section 194S) | None | None |
Expense Deductions | Only cost of acquisition | Fund expenses, brokerage | Brokerage, storage costs |
After-Tax SIP Returns: The Final Comparison
Metric | Bitcoin SIP | Nifty 50 SIP | Gold SIP |
Pre-Tax Value | Rs 3.85 crore | Rs 22.44 lakh | Rs 41.81 lakh |
Total Gains | Rs 3.73 crore | Rs 10.04 lakh | Rs 29.41 lakh |
Tax Rate Applied | 30% flat | 12.5% (above Rs 1.25L exemption) | 12.5% flat on gains |
Tax Payable | Rs 11.18 lakh | Rs 1.10 lakh | Rs 3.68 lakh |
After-Tax Value | Rs 2.73 crore | Rs 21.34 lakh | Rs 38.14 lakh |
Tax as % of Gains | 30.0% | 10.9% | 12.5% |
Effective Post-Tax Multiple | 22.0x | 1.7x | 3.1x |
The tax impact on Bitcoin is staggering. An investor who earned Rs 3.73 crore in gains would owe approximately Rs 11.18 lakh in tax — an amount that exceeds the total Nifty 50 SIP corpus. The 30% flat rate with zero deductions, zero loss offset, and zero carry-forward makes crypto the single most punitively taxed asset class in India.
The Nifty 50 investor, by contrast, pays just Rs 1.10 lakh in tax thanks to the Rs 1.25 lakh annual exemption. The gold investor pays Rs 3.30 lakh at 12.5% — still significantly less than the Bitcoin investor despite having lower absolute returns.
This tax disparity has remained unchanged across four consecutive Union Budgets (2023 through 2026), with no indication of reform.
The Crypto Derivatives Alternative: A Different Tax Calculation
There is a structural exception within India's tax code that changes this equation. Crypto derivatives — futures and options on Bitcoin, Ethereum, and other assets — are classified as speculative business income under Section 43(5) and Section 73 of the Income Tax Act. This means they are taxed at slab rates (not the flat 30%), allow business expense deductions, permit loss offset against other speculative income, and offer four-year carry-forward of losses.
Managed crypto derivatives portfolios — such as those offered by platforms like Grade Capital — use this structure to provide crypto exposure with materially lower effective tax rates for investors in the lower tax brackets. Additionally, derivatives strategies using options can generate returns in falling markets, partially mitigating the drawdown problem that pure spot Bitcoin SIPs face.
What This Data Actually Tells Indian Investors
The data supports neither the crypto maximalist position (that Bitcoin is categorically superior) nor the traditional finance view (that crypto is pure speculation). It supports a more nuanced conclusion.
Bitcoin has delivered extraordinary long-term returns through SIP — but with drawdowns that would cause most retail investors to exit at the worst possible time. Dollar-cost averaging reduces but does not eliminate this volatility risk.
Gold has been the quiet outperformer of this decade, especially since 2024. A 3.1x return with virtually no drawdown and a favourable tax rate makes it the most efficient risk-adjusted performer on a post-tax basis relative to its volatility.
Nifty 50 has compounded reliably at roughly 12% XIRR with moderate drawdowns and the most favourable tax treatment. It remains the foundation of any diversified Indian portfolio.
The most informed approach is not choosing one over the other — it is understanding what each asset contributes to a portfolio in terms of return, risk, tax efficiency, and liquidity, and allocating accordingly.
A Framework for Indian Investors: The 70-20-10 Starting Point
Based on the 10-year data, one framework gaining traction among wealth advisors is a 70-20-10 allocation: 70% in equity (Nifty 50 or diversified equity mutual funds) for reliable compounding, 20% in gold for inflation protection and low-correlation stability, and 10% in crypto for asymmetric upside exposure. Even a small Bitcoin allocation — when combined with systematic monthly investing — would have materially improved total portfolio returns over this decade without catastrophically increasing portfolio-level risk.
Consider this: if an investor had allocated Rs 7,000 to Nifty, Rs 2,000 to gold, and Rs 1,000 to Bitcoin monthly since 2016, the blended portfolio would be worth approximately Rs 55 lakh — versus Rs 22.44 lakh for pure Nifty, Rs 38.79 lakh for pure gold, and Rs 3.85 crore for pure Bitcoin. The blended portfolio captures meaningful upside from Bitcoin's exponential growth while maintaining a volatility profile closer to traditional assets.
For investors concerned about the 30% crypto tax drag, crypto derivatives offer a structural alternative. The same Bitcoin exposure through managed derivatives strategies — taxed at slab rates rather than 30% flat — can reduce the effective tax burden by 40-60% for investors in the lower tax brackets.
Want to understand how risk-adjusted metrics like the Sharpe Ratio apply to crypto? Read our detailed guide: Sharpe Ratio Explained: Why Risk-Adjusted Returns Matter in Crypto.
Disclaimer: This content is for informational and educational purposes only and does not constitute financial advice or an offer to invest. Past performance is not indicative of future results. The backtest uses historical price data and simplified assumptions; actual SIP returns may vary based on execution prices, exchange rates, and transaction costs. Tax treatment depends on individual circumstances and the prevailing interpretation of tax laws. Investors are advised to consult with qualified tax professionals. Projections and forward-looking statements are estimates and not forecasts of actual performance.